Variability in Barbados’ Rainfall Pattern:
An El Nino/La Nina Perspective
BY
Sonia Nurse
Deputy Director (Ag)
Barbados Meteorological Services
Issued: October,2011
Introduction
Although El Niño and La Niña events are characterized by warmer or cooler than average sea surface temperatures in the tropical Pacific, they are also associated with changes in wind, pressure, and rainfall patterns. In the tropics where El Niño and La Niña form, rainfall tends to occur over areas having the warmest sea surface temperature.
La Niña is characterized by unusually cool ocean surface temperatures in the central and eastern tropical Pacific. It is the opposite of El Niño, which is marked by unusually warm ocean surface temperatures. Both are strongly coupled to the atmospheric circulation in the tropics and are major – but not the only - determinants of the seasonal and year-to-year fluctuations of our climate. Thus, these events also impact the number of tropical cyclones which develop over the Atlantic with fewer storms forming during El Nino years and above-normal hurricane activity being experienced in La Nina situations.
The present La Niña follows closely behind the moderate to strong La Niña that started in September 2010 and ended with neutral conditions established in May 2011, when ocean temperatures, tropical rainfall patterns, and atmospheric winds over the equatorial Pacific Ocean returned to near the long-term average. The neutral conditions subsequently gave way to a re-emergence of La Niña. By the end of October,2011 the La Niña had slowly strengthened to a weak-to-moderate level.
Barbados’ Rainfall: 1981 to 2010
The question of whether Barbados is experiencing increasing rainfall levels is one which is being asked with increasing frequency.
In order to answer this question we look at rainfall data taken at the Grantley Adams Airport from 1981 to 2010. This is tabulated below in ten-year periods.
|
YEAR |
Rainfall Total (in) |
YEAR |
Rainfall Total (in) |
YEAR |
Rainfall Total (in) |
|
|
1981 |
68.47 |
1991 |
51.04 |
2001 |
47.95 |
|
|
1982 |
41.00 |
1992 |
52.77 |
2002 |
37.98 |
|
|
1983 |
38.22 |
1993 |
41.87 |
2003 |
38.56 |
|
|
1984 |
53.50 |
1994 |
44.81 |
2004 |
63.92 |
|
|
1985 |
53.90 |
1995 |
50.47 |
2005 |
66.34 |
|
|
1986 |
44.82 |
1996 |
48.76 |
2006 |
45.17 |
|
|
1987 |
45.69 |
1997 |
40.80 |
2007 |
50.13 |
|
|
1988 |
56.83 |
1998 |
60.14 |
2008 |
58.19 |
|
|
1989 |
40.82 |
1999 |
49.13 |
2009 |
39.92 |
|
|
1990 |
49.44 |
2000 |
50.37 |
2010 |
74.20 |
|
|
TOTAL |
492.69 |
|
490.16 |
|
522.36 |
|
|
10-Year Average |
49.26 |
|
49. 01 |
|
52.23 |
|
N.B: 30-year average rainfall total (1981-2010) at G.A.I.A is 46.41 inches.
On the face of the data tabulated above, it would appear at first glance that the premise is true since the first two ten-year periods show an average rainfall of 49.26 inches and 49.01 inches respectively whereas the last ten-year period of 2001 to 2010 gives an average of 52.23 inches.
A more in-depth look at each ten-year period reveals some years with well-below the thirty-year average which can be shown to coincide with El Nino events while years with above- average rainfall coincide with La Nina events. Examples of the former are 1982 and 1983 with 41inches and 38.22 inches respectively which coincidentally were strong El Nino years while the highest rainfall year in this same ten-year period was 1981 which produced some 68.47 inches of rainfall and is associated with a La Nina year.
A similar comparison can be made for the period 1991 to 2000. The lowest rainfall recorded during this period was 40.8inches in 1997 which was also another El Nino year. The extreme of 60 inches during this period resulted in the following year 1998 as conditions transitioned to a La Nina situation.
Another below normal period was 2002 and 2003 in which we recorded 37.98 and 38.56 inches respectively at the Airport. These were also designated El Nino years but were subsequently followed by another two-year spell of La Nina conditions which resulted in above-normal rainfall for Barbados with 63.92 inches in 2004 and 66.34 inches in 2005.
The next and most recent El Nino event occurred in 2009 when total rainfall for the year dipped to 39.92 inches. The relatively dry conditions associated with this episode continued into the first quarter of 2010. The overall picture was one of a ‘dry’ wet season between June and November of 2009 and a drier than normal dry season at the start of 2010.
However, conditions quickly transitioned to a La Nina event in late April/early May of 2010; these conditions persisted to the end of the year and well into 2011. The result was that the rainfall total for 2010 reached an all-time high of 74.2 inches which is also the highest total rainfall for the Airport since 1942. This total eclipsed the previous record of 71 inches which occurred in 1966.
The October, 2010 total rainfall of 18 inches was also the highest ever October total while the close to 13 inches recorded during the passage of what at the time was Tropical Storm “Tomas”, would have contributed significantly to the final result.
Cumulative Rainfall: January to May
Another interesting observation about our rainfall pattern relates to the 30-YEAR cumulative rainfall average which is 10.15 inches for the period January to May.
The table below shows some recent La Nina years in which the cumulative rainfall for the period January to May of those respective years being double and in one case nearly triple the 30-year average. In such years, final rainfall yearly totals exceeded 60 inches.
A similar trend developed this year (2011) which is in keeping with the La Nina pattern which waned during the middle of the year but returned during the last few months. The final rainfall accumulation for 2011 was 66.30 inches.
|
Year |
Cumulative Rainfall: Jan to May |
Year Total (“ = inches) |
|
1981 |
27.01” |
65.47” |
|
2004 |
18.76” |
63.92” |
|
2005 |
19.83” |
66.34” |
|
2011 |
19.97” |
66.30” |
N.B: 1 inch = 25.4mm
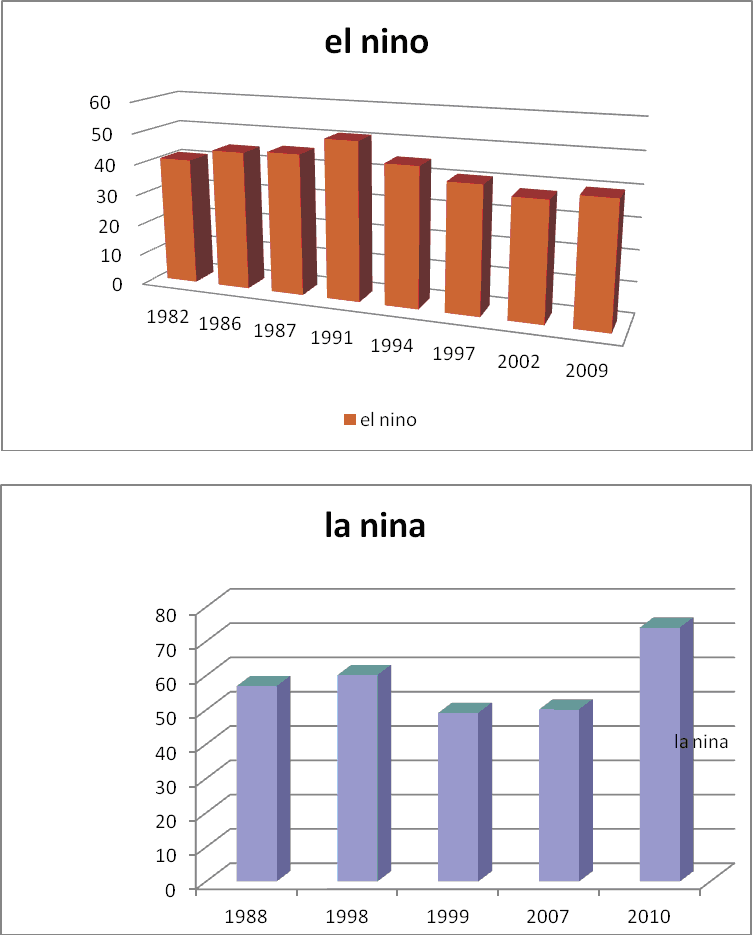
Rainfall(inches) at G.A. I.A in El Nino vs La Nina Years
Conclusions
Based on the data above, we may conclude that our rainfall pattern is influenced to a large extent by the presence of El Nino/ La Nina events with above-normal rainfall occurring during La Nina episodes and below-normal rainfall resulting during an El Nino event.
While they may be other factors which contribute to the duration and intensity of each event the improvements in forecasting of these climate extremes can go a long way to predicting the onset of a warm or cold phase. Such forecasts are critical in helping farmers and other stakeholders plan for and mitigate potential losses.
Advances in improved climate predictions will also result in significantly enhanced economic opportunities, particularly for the national agriculture, fishing, forestry and energy sectors.